

Abstract
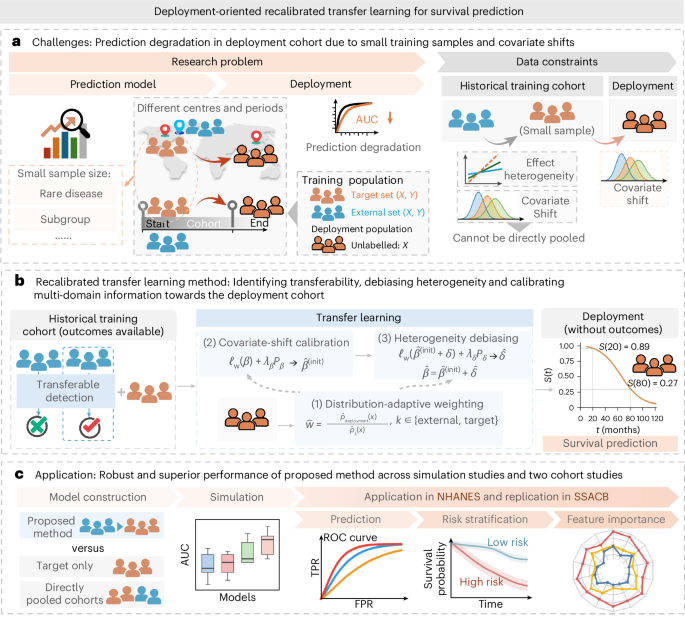
Clinical prediction models often underperform in deployment populations that differ from historical training cohorts because of covariate shifts, but outcome-based updating is infeasible when deployment outcomes are unavailable. This challenge is further amplified when the target training cohort has limited samples or sparse events. Here we propose CoxRTL, a transfer learning framework with deployment-covariate recalibration for survival prediction under covariate shift. CoxRTL borrows information from external cohorts to improve estimation, uses transferability screening and debiasing to mitigate external effect heterogeneity, and embeds density-ratio weighting into transfer estimation, yielding a distribution-adaptive weighted partial likelihood that aligns historical training cohorts with the deployment-covariate distribution. We evaluated CoxRTL in simulations and two cohorts. Simulations showed improved prediction under training–deployment covariate shift. Using early National Health and Nutrition Examination Survey data, we developed prognostic models for 20 chronic diseases in older adults and evaluated their performance in later survey cohorts. CoxRTL achieved higher discrimination than models trained only in older adults (median C-index improvement, 0.056; range, 0.016–0.126) or in the full population (0.042; 0.013–0.107). It also improved calibration, clinical utility and risk stratification, while identifying variables with greater predictive contribution across diseases. Independent replication in the Shanghai Suburban Adult Cohort and Biobank confirmed robustness under geographic and temporal shifts. These findings support CoxRTL as a feasible strategy for developing prediction models for prespecified deployment populations when target training data are limited.
This is a preview of subscription content, access
Access options
- Purchase on SpringerLink
- Instant access to the full article PDF.
Prices may be subject to local taxes which are calculated during checkout
Subjects
Data availability
The data analysed in this study were obtained from the NHANES and the Linked Mortality Files. NHANES survey data are publicly available at https://wwwn.cdc.gov/nchs/nhanes/, and the Linked Mortality Files are available at https://www.cdc.gov/nchs/data-linkage/mortality-public.htm. The simulation datasets can be generated using the publicly available code provided in the Code Ocean capsule48. The SSACB datasets that support the findings of this study are held by the School of Public Health, Fudan University. Restrictions apply to the availability of these datasets, which were used under license for the current study and are not publicly available. The datasets are available from the authors upon request and with permission of the School of Public Health, Fudan University. Source data are provided with this paper.
Code availability
The CoxRTL implementation code is freely available in the Code Ocean capsule at https://codeocean.com/capsule/7664785/tree/v1 (ref. 48).
References
-
Youssef, A. et al. External validation of AI models in health should be replaced with recurring local validation. Nat. Med.29, 2686–2687 (2023).
-
Steingrimsson, J. A., Gatsonis, C., Li, B. & Dahabreh, I. J. Transporting a prediction model for use in a new target population. Am. J. Epidemiol.192, 296–304 (2023).
-
Kagerbauer, S. M. et al. Susceptibility of AutoML mortality prediction algorithms to model drift caused by the COVID pandemic. BMC Med. Inform. Decis. Mak.24, 34 (2024).
-
Lasko, T. A., Strobl, E. V. & Stead, W. W. Why do probabilistic clinical models fail to transport between sites. npj Digit. Med.7, 53 (2024).
-
Davis, S. E., Lasko, T. A., Chen, G., Siew, E. D. & Matheny, M. E. Calibration drift in regression and machine learning models for acute kidney injury. J. Am. Med. Inform. Assoc.24, 1052–1061 (2017).
-
Haines, R. W. et al. Acute kidney injury in trauma patients admitted to critical care: development and validation of a diagnostic prediction model. Sci. Rep.8, 3665 (2018).
-
Habib, A. R., Lin, A. L. & Grant, R. W. The epic sepsis model falls short—the importance of external validation. JAMA Intern. Med.181, 1040–1041 (2021).
-
Booth, S., Riley, R. D., Ensor, J., Lambert, P. C. & Rutherford, M. J. Temporal recalibration for improving prognostic model development and risk predictions in settings where survival is improving over time. Int. J. Epidemiol.49, 1316–1325 (2020).
-
Han, L. Addressing distribution shift for robust and trustworthy prediction and causal inference in clinical AI settings. JAMA Netw. Open8, e2513705 (2025).
-
Kennedy, H. A. et al. Chronic renal failure and bladder augmentation: stomach versus sigmoid colon in the canine model. J. Urol.140, 1138–1140 (1988).
-
Steingrimsson, J. A. Extending prediction models for use in a new target population with failure time outcomes. Biostatistics24, 728–742 (2023).
-
SCORE2-OP Working Group and ESC Cardiovascular Risk Collaboration. SCORE2-OP risk prediction algorithms: estimating incident cardiovascular event risk in older persons in four geographical risk regions. Eur. Heart. J.42, 2455–2467 (2021).
-
van Bussel, E. F. et al. A cardiovascular risk prediction model for older people: development and validation in a primary care population. J. Clin. Hypertens.21, 1145–1152 (2019).
-
Li, Y., Wang, L., Wang, J., Ye, J. & Reddy, C. K. Transfer learning for survival analysis 16th International Conference on Data Mining (ICDM) 231–240 (IEEE, 2016)
-
Wang, X. et al. SurvMaximin: robust federated approach to transporting survival risk prediction models. J. Biomed. Inform.134, 104176 (2022).
-
Zhang, X. et al. A hybrid adaptive approach for instance transfer learning with dynamic and imbalanced data. Int. J. Intell. Syst.37, 11582–11599 (2022).
-
Lu, Y., Gu, T. & Duan, R. Adaptive transfer learning for time-to-event modeling with applications in disease risk assessment. Biostatistics27, kxag011 (2026).
-
Shimodaira, H. Improving predictive inference under covariate shift by weighting the log-likelihood function. J. Stat. Plann. Inference90, 227–244 (2000).
-
Fan, J. & Li, R. Variable selection for Cox’s proportional hazards model and frailty model. Ann. Stat.30, 74–99 (2002).
-
Du, P., Ma, S. & Liang, H. Penalized variable selection procedure for Cox models with semiparametric relative risk. Ann. Stat.38, 2092–2117 (2010).
-
Zhang, W., Deng, L., Zhang, L. & Wu, D. A survey on negative transfer. IEEE/CAA J. Autom. Sin.10, 305–329 (2023).
-
Riley, R. D. et al. Calculating the sample size required for developing a clinical prediction model. BMJ368, m441 (2020).
-
Rodondi, N. et al. Framingham risk score and alternatives for prediction of coronary heart disease in older adults. PLoS ONE7, e34287 (2012).
-
Vickers, A. J., Van Calster, B. & Steyerberg, E. W. Net benefit approaches to the evaluation of prediction models, molecular markers, and diagnostic tests. BMJ352, i6 (2016).
-
Golinelli, D. et al. Population risk stratification tools and interventions for chronic disease management in primary care: a systematic literature review. BMC Health Serv. Res.25, 526 (2025).
-
Lin, J. S., Evans, C. V., Grossman, D. C., Tseng, C. W. & Krist, A. H. Framework for using risk stratification to improve clinical preventive service guidelines. Am. J. Prev. Med.54, S26–S37 (2018).
-
Patel, B. S., Steinberg, E., Pfohl, S. R. & Shah, N. H. Learning decision thresholds for risk stratification models from aggregate clinician behavior. J. Am. Med. Inform. Assoc.28, 2258–2264 (2021).
-
Drexler, Y. et al. Associations between albuminuria and mortality among US adults by demographic and comorbidity factors. J. Am. Heart Assoc.12, e030773 (2023).
-
Sanchez-Sanchez, J. L. et al. Association of intrinsic capacity with functional decline and mortality in older adults: a systematic review and meta-analysis of longitudinal studies. Lancet Healthy Longev.5, e480–e492 (2024).
-
Yadav, S., Deepika, & Maurya, P. K. A systematic review of red blood cells biomarkers in human aging. J. Gerontol. A79, glae004 (2024).
-
Franceschi, C., Garagnani, P., Parini, P., Giuliani, C. & Santoro, A. Inflammaging: a new immune-metabolic viewpoint for age-related diseases. Nat. Rev. Endocrinol.14, 576–590 (2018).
-
Hao, M. et al. Ratio of red blood cell distribution width to albumin level and risk of mortality. JAMA Netw. Open7, e2413213 (2024).
-
Araujo-Moura, K. et al. Prediction of hypertension in the pediatric population using machine learning and transfer learning: a multicentric analysis of the SAYCARE study. Int. J. Public Health70, 1607944 (2025).
-
Marshall, J. C. et al. Multiple organ dysfunction score: a reliable descriptor of a complex clinical outcome. Crit. Care Med.23, 1638–1652 (1995).
-
Rahmani, K. et al. Assessing the effects of data drift on the performance of machine learning models used in clinical sepsis prediction. Int. J. Med. Inform.173, 104930 (2023).
-
Lu, Y., Gu, T. & Duan, R. Enhancing genetic risk prediction through federated semi-supervised transfer learning with inaccurate electronic health record data. Stat. Biosci.https://doi.org/10.1007/s12561-024-09449-2 (2024).
-
Katzman, J. L. et al. DeepSurv: personalized treatment recommender system using a Cox proportional hazards deep neural network. BMC Med. Res. Methodol.18, 24 (2018).
-
Gretton, A., Borgwardt, K. M., Rasch, M. J., Schölkopf, B. & Smola, A. A kernel two-sample test. J. Mach. Learn. Res.13, 723–773 (2012).
-
White, I. R., Royston, P. & Wood, A. M. Multiple imputation using chained equations: issues and guidance for practice. Stat. Med.30, 377–399 (2011).
-
Heagerty, P. J., Lumley, T. & Pepe, M. S. Time-dependent ROC curves for censored survival data and a diagnostic marker. Biometrics56, 337–344 (2000).
-
Pencina, M. J., D’Agostino, R. B. Sr. & Steyerberg, E. W. Extensions of net reclassification improvement calculations to measure usefulness of new biomarkers. Stat. Med.30, 11–21 (2011).
-
Uno, H., Tian, L., Cai, T., Kohane, I. S. & Wei, L. J. A unified inference procedure for a class of measures to assess improvement in risk prediction systems with survival data. Stat. Med.32, 2430–2442 (2013).
-
Gerds, T. A. & Schumacher, M. Consistent estimation of the expected Brier score in general survival models with right-censored event times. Biom. J.48, 1029–1040 (2006).
-
Steyerberg, E. W. et al. Assessing the performance of prediction models: a framework for traditional and novel measures. Epidemiology21, 128–138 (2010).
-
Strobl, C., Boulesteix, A. L., Kneib, T., Augustin, T. & Zeileis, A. Conditional variable importance for random forests. BMC Bioinformatics9, 307 (2008).
-
Liu, X., Bai, Y., Lu, Y., Soltoggio, A. & Kolouri, S. Wasserstein task embedding for measuring task similarities. Neural Netw.181, 106796 (2025).
-
Zhao, Q. et al. Cohort profile: protocol and baseline survey for the Shanghai Suburban Adult Cohort and Biobank (SSACB) study. BMJ Open10, e035430 (2020).
-
Pan, L., Zhao, G., Yu, Y. & Qin, G. Transfer learning with deployment-covariate recalibration for survival prediction under covariate shift. Code Oceanhttps://codeocean.com/capsule/7664785/tree/v1 (2026).
Acknowledgements
We thank the participants and staff of the NHANES and the SSACB for their contributions. We acknowledge the NCHS for providing the NHANES data and linked mortality files. We also appreciate the efforts of the SSACB investigators and collaborators in data collection and management. Finally, we thank G. Qin and Y. Yu for their guidance and financial support.
Funding
This work was supported by Shanghai Municipal Science and Technology Major Project (ZD2021CY001 to G.Q.), National Natural Science Foundation of China (number 82473724 to G.Q., number 82273730 to Y.Y.), Shanghai Talent Programs (BJKJ2024050 to Y.Y.), and the Shuguang Program of the Shanghai Education Development Foundation and Shanghai Municipal Education Commission (Y.Y.). The funders had no role in study design, data collection and analysis, decision to publish or preparation of the paper.
Authors and Affiliations
Contributions
L.P. conceived of the study, performed the statistical analysis, interpreted the data and drafted the paper. G.Q. and Y.Y. contributed to the study conception, provided overall supervision, and performed critical revision and final editing of the paper. G.Z. was contributed to the establishment and maintenance of the database. All authors have read and approved the final paper.
Ethics declarations
Competing interests
The authors declare no competing interests.
Peer review
Peer review information
Nature Machine Intelligence thanks the anonymous reviewers for their contribution to the peer review of this work.
Additional information
Publisher’s note Springer Nature remains neutral with regard to jurisdictional claims in published maps and institutional affiliations.
Extended data
Extended Data Fig. 1 Wasserstein distances between external, target, and deployment cohorts before and after covariate-shift adjustment across 20 diseases.
Wasserstein distances were used to quantify covariate distribution differences between the external, target and deployment cohorts across 20 chronic disease datasets. Points connected by horizontal lines compare distances before and after covariate-shift adjustment. Abbreviations: HF, heart failure; MI, myocardial infarction; CHD, coronary heart disease; COPD, chronic obstructive pulmonary disease; T2DM, type 2 diabetes mellitus; CKD, chronic kidney disease.
Extended Data Fig. 2 Weight distributions and normalized effective sample size for density-ratio weighting across all diseases in NHANES and SSACB.
Box plots show the normalized density-ratio weights used to align the external and target training datasets with the calibration subset of the deployment population for each disease in a, NHANES and b, SSACB. Disease-specific sample sizes are provided in Supplementary Tables 11 and 32. Weights were normalized to have a mean of 1, and the y-axis is shown on a log10 scale. ESS/n denotes the normalized effective sample size, with higher values indicating more stable weights and smaller effective sample size loss. In each box plot, the centre line denotes the median, box bounds denote the first and third quartiles, and whiskers extend to the most extreme values within 1.5 times the interquartile range from the box bounds.
Extended Data Fig. 3 Three-year model performance of CoxRTL versus comparative models across chronic disease datasets.
CoxRTL was compared with Cox-t and Cox-all models, with performance evaluated separately in each chronic disease dataset. Disease-specific sample sizes are provided in Supplementary Table 11. a, Three-year discrimination performance. The radar chart displays disease-specific 3-year AUC estimates for each model, and the difference plot shows the 3-year AUC gains achieved by CoxRTL relative to Cox-all and Cox-t. b, Three-year reclassification performance. Difference plots show the 3-year IDI and NRI for CoxRTL relative to Cox-all and Cox-t. Points in the difference plots represent between-model differences, and error bars denote two-sided 95% bootstrap confidence intervals based on 1,000 bootstrap resamples. A 95% confidence interval excluding zero indicates statistical significance. Abbreviations: HF, heart failure; CKD, chronic kidney disease; T2DM, type 2 diabetes mellitus; COPD, chronic obstructive pulmonary disease; CHD, coronary heart disease; MI, myocardial infarction; Cox-t: penalized Cox model fitted only on the target dataset; Cox-all: stratified penalized Cox model fitted on the pooled target and external datasets; CoxRTL: proposed recalibrated transfer-learning Cox model that leverages both target and external datasets while aligning covariate distributions to the deployment population.
Extended Data Fig. 4 Five-year calibration curves for CoxRTL and comparative models across 20 chronic diseases in NHANES.
The dashed diagonal line represents perfect calibration, where predicted survival probability equals observed survival probability. Curves closer to the diagonal indicate better agreement between predicted and observed survival. CoxRTL was compared with Cox-t and Cox-all for each disease. Abbreviations: HF, heart failure; CKD, chronic kidney disease; T2DM, type 2 diabetes mellitus; COPD, chronic obstructive pulmonary disease; CHD, coronary heart disease; MI, myocardial infarction; Cox-t: penalized Cox model fitted only on the target dataset; Cox-all: stratified penalized Cox model fitted on the pooled target and external datasets; CoxRTL: proposed recalibrated transfer-learning Cox model that leverages both target and external datasets while aligning covariate distributions to the deployment population.
Extended Data Fig. 5 Predictive performance of CoxRTL versus neural network–based survival models across 20 chronic diseases in NHANES.
CoxRTL was compared with DeepSurv and DeepSurv-MMD models, with performance evaluated separately in each chronic disease dataset. Disease-specific sample sizes are provided in Supplementary Table 11. Points in the radar charts represent disease-specific estimates of mortality prediction performance. Points in the difference plots represent between-model differences, and error bars denote two-sided 95% bootstrap confidence intervals based on 1,000 bootstrap resamples. a, Discrimination: radar charts display absolute Harrell’s C-index and 5-year AUC values. Difference plots show the absolute gains in these metrics achieved by CoxRTL relative to comparative models. b, Reclassification: plots show the 5-year risk reclassification improvement (IDI and NRI). c, Prediction error: the radar chart depicts the IBS, and the difference plots display the reductions in IBS and 5-year Brier Score for CoxRTL. For all difference plots in a–c, a 95% CI excluding zero indicates statistical significance. Abbreviations: HF, heart failure; CKD, chronic kidney disease; T2DM, type 2 diabetes mellitus; COPD, chronic obstructive pulmonary disease; CHD, coronary heart disease; MI, myocardial infarction; DeepSurv: a target-trained neural-network survival model; DeepSurv-MMD: a domain-adaptive neural network survival model trained on target dataset; CoxRTL: proposed recalibrated transfer-learning Cox model that leverages both target and external datasets while aligning covariate distributions to the deployment population.
Extended Data Fig. 6 Five-year decision curve analysis for CoxRTL and comparative models across 20 chronic diseases in NHANES.
The gray line represents the strategy of treating all individuals, and the black horizontal line represents the strategy of treating none. A higher net benefit at a given threshold probability indicates greater clinical utility for risk-based decision-making. Abbreviations: HF, heart failure; CKD, chronic kidney disease; T2DM, type 2 diabetes mellitus; COPD, chronic obstructive pulmonary disease; CHD, coronary heart disease; MI, myocardial infarction; Cox-t: penalized Cox model fitted only on the target dataset; Cox-all: stratified penalized Cox model fitted on the pooled target and external datasets; CoxRTL: proposed recalibrated transfer-learning Cox model that leverages both target and external datasets while aligning covariate distributions to the deployment population.
Extended Data Fig. 7 Screening performance and risk stratification of CoxRTL versus neural network–based survival models in the NHANES validation set.
CoxRTL was compared with DeepSurv, and DeepSurv-MMD models, with analyses performed separately in each chronic disease dataset. Disease-specific sample sizes are provided in Supplementary Table 11. a, Screening performance: points show 5-year detection rates (DRs) for mortality prediction across 20 chronic diseases. b, Risk stratification: points show hazard ratios (HRs) comparing high-risk with low-risk groups, and error bars denote two-sided 95% confidence intervals (CIs). Higher HRs indicate stronger separation between risk groups. c, Kaplan–Meier curves for the 12 diseases with the largest stratification improvements. Dashed and solid lines denote high-risk and low-risk groups, respectively. Abbreviations: HF, heart failure; CKD, chronic kidney disease; T2DM, type 2 diabetes mellitus; COPD, chronic obstructive pulmonary disease; CHD, coronary heart disease; MI, myocardial infarction; DeepSurv: a target-trained neural-network survival model; DeepSurv-MMD: a domain-adaptive neural network survival model trained on target dataset; CoxRTL: proposed recalibrated transfer-learning Cox model that leverages both target and external datasets while aligning covariate distributions to the deployment population.
Extended Data Fig. 8 Sex-stratified C-index performance of CoxRTL versus comparative models in NHANES.
CoxRTL was compared with Cox-t and Cox-all models, with C-index performance evaluated separately within female and male participants in each chronic disease dataset. Disease- and sex-specific sample sizes are provided in Supplementary Table 42. Points represent disease-specific estimates of mortality prediction performance. Abbreviations: HF, heart failure; CKD, chronic kidney disease; T2DM, type 2 diabetes mellitus; COPD, chronic obstructive pulmonary disease; CHD, coronary heart disease; MI, myocardial infarction; Cox-t: penalized Cox model fitted only on the target dataset; Cox-all: stratified penalized Cox model fitted on the pooled target and external datasets; CoxRTL: proposed recalibrated transfer-learning Cox model that leverages both target and external datasets while aligning covariate distributions to the deployment population.
Extended Data Fig. 9 Sensitivity analysis of c-index results using models trained on different NHANES survey cycles and varying age thresholds for defining target, external and deployment datasets.
Disease-specific sample sizes are provided in Supplementary Tables 44, 46, and 48. Points represent disease-specific C-index estimates. Abbreviations: HF, heart failure; CKD, chronic kidney disease; T2DM, type 2 diabetes mellitus; COPD, chronic obstructive pulmonary disease; CHD, coronary heart disease; MI, myocardial infarction; Cox-t: penalized Cox model fitted only on the target dataset; Cox-all: stratified penalized Cox model fitted on the pooled target and external datasets; CoxRTL: proposed recalibrated transfer-learning Cox model that leverages both target and external datasets while aligning covariate distributions to the deployment population.
Supplementary information
Supplementary Methods and Figs. 1–6.
Supplementary Tables 1–55.
Rights and permissions
Springer Nature or its licensor (e.g. a society or other partner) holds exclusive rights to this article under a publishing agreement with the author(s) or other rightsholder(s); author self-archiving of the accepted manuscript version of this article is solely governed by the terms of such publishing agreement and applicable law.
About this article
Cite this article
Pan, L., Zhao, G., Yu, Y. et al. Transfer learning with deployment-covariate recalibration for survival prediction under covariate shift.
Nat Mach Intell8, 1312–1326 (2026). https://doi.org/10.1038/s42256-026-01285-x
-
Version of record:18 August 2026
-
DOI
:https://doi.org/10.1038/s42256-026-01285-x
