

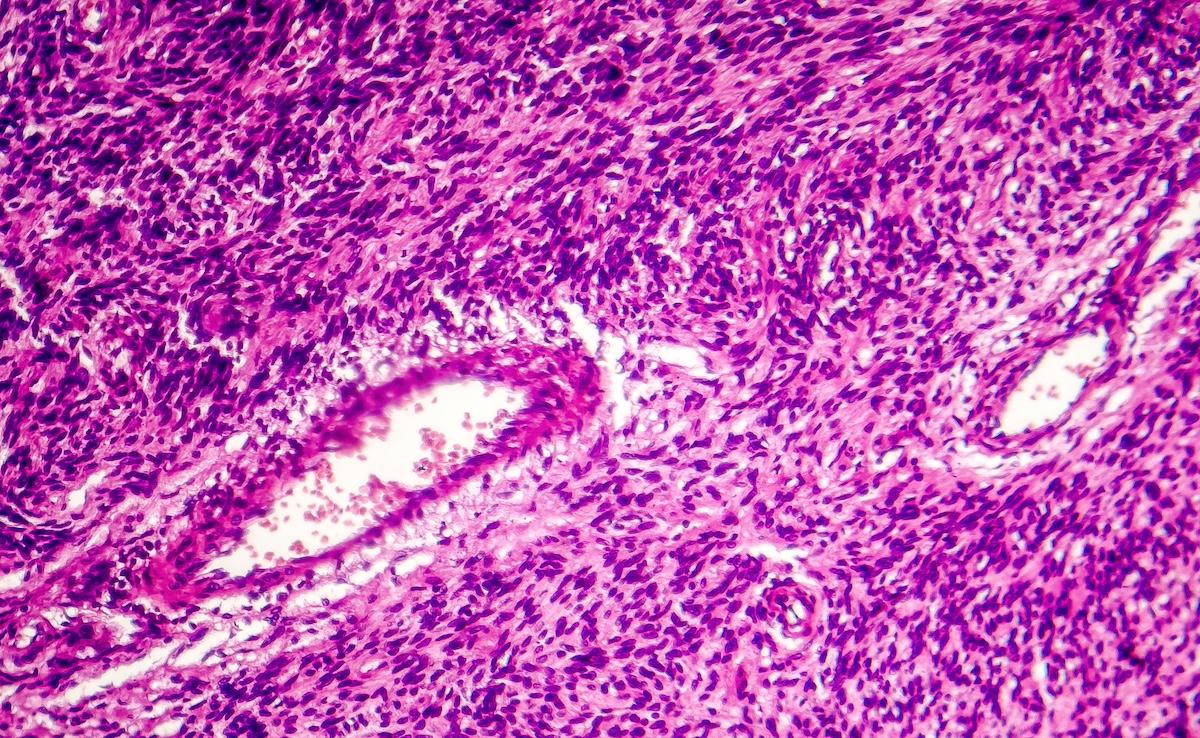
Machine learning models for upper extremity soft tissue sarcoma had a C-index of 0.79 for local recurrence, similar to nomograms, in a 188-patient cohort.
Machine learning models built specifically for upper extremity (STS) forecast overall survival (OS), local recurrence (LR), and distant metastasis (DM) about as well as established prognostic nomograms, according to a single-center study published in .1 The best LR model reached a concordance index (C-index) of 0.79 in a cohort of 188 patients.
The authors framed the work as a feasibility study. Calibration was imperfect for 2 of the 3 outcomes, and the models need recalibration and external validation in independent, ideally multicenter, cohorts before clinical use.
Prognostic Gaps in Upper Extremity Sarcoma
The American Cancer Society projects 13,910 new STS diagnoses and 5400 deaths from the disease in the US in 2026.2 About 15% of tumors arise in an upper extremity, the authors noted, where dense neurovascular anatomy, frequent unplanned excisions before referral, and close margins complicate surgery.1
Established tools such as Sarculator, PERsonalised SARcoma Care (PERSARC), and the Memorial Sloan Kettering Cancer Center (MSKCC) nomogram were built on cohorts that pooled truncal and extremity tumors, and the same University of California, Los Angeles, group previously found that they performed suboptimally in upper extremity STS.1,3
How the Machine Learning Models Were Built
The researchers reviewed records for 188 patients treated for primary, nonmetastatic upper extremity STS at a high-volume sarcoma center from 2012 through 2022.1 Median patient age was 56 years, 72% of tumors were grade 3, and the median largest tumor dimension was 5.8 cm. Almost half (46%) of patients started care at an outside hospital, 47% had an unplanned excision before referral, and 89% ultimately had negative margins.
Over a median (IQR) follow-up of 3.9 years (1.4-6.9), LR occurred in 47 patients (25%), DM in 37 (20%), and death in 25 (13%). The team compared 5 survival algorithms, from penalized Cox regression to random survival forest and support vector machine approaches, using nested cross-validation, treating death as a competing risk.
Recurrence and Survival Prediction Results
The top-performing models had a C-index of 0.79 for LR (95% variability interval, 0.68-0.89), 0.67 for DM (0.44-0.86), and 0.75 for OS (0.54-0.90); the authors attributed the wide intervals to modest event counts. Models using fewer predictors performed similarly (0.78, 0.66, and 0.69, respectively). High- and low-risk groups, split at the median predicted risk, separated clearly for all 3 outcomes.
On matched patient subsets, discrimination was comparable to PERSARC for LR (0.79 vs 0.83) and to Sarculator for DM (0.68 vs 0.66), and OS discrimination did not differ significantly from either tool. The best LR model outperformed the MSKCC nomogram (0.90 vs 0.68; difference, 0.23; 95% CI, 0.01-0.47), but only 41 patients and 9 events were eligible for that comparison, and the other 4 algorithms showed no significant difference. No algorithm consistently outperformed the rest.
“The value of these models lies not in a discrimination advantage for any one method, but in providing multi-outcome risk estimates within a single competing-risks framework, together with interpretable directional predictors and reduced overfitting through regularization and within-fold feature selection,” the authors wrote.
Leading predictors included re-excision for positive margins and initial outside-hospital treatment for LR; adjuvant systemic therapy, amputation, and neighborhood deprivation for DM; and outside-hospital treatment, older age, and flap reconstruction for OS. The authors cautioned that treatment variables reflect disease severity and clinical judgment rather than causal effects and that the link between outside-hospital care and better OS likely reflects referral patterns.
The retrospective, single-center design may introduce selection bias and limit generalizability. Because the models rely on postsurgical information such as margin status and adjuvant treatment, they cannot inform preoperative counseling. Calibration slopes for LR (2.45) and OS (1.38) exceeded 1.0, and nomogram comparisons drew on small subsets. The authors suggested that adding imaging and pathology data and pooling multicenter cohorts may strengthen future models.
“Parsimonious outcome-specific models with reduced feature sets achieved discrimination comparable to full-variable models, and the analysis identifies the leading directional predictors of each outcome,” the authors wrote. “Calibration requires refinement, and external validation is needed before clinical implementation.”
1. Khabaz K, Newman-Hung NJ, Ding R, et al. Machine learning-based recurrence and survival prediction in a large institutional upper extremity soft tissue sarcoma cohort. J Surg Oncol. Published online October 12, 2026. doi:10.1002/jso.70422
2. Key statistics for soft tissue sarcomas. American Cancer Society. Updated February 9, 2026. Accessed November 11, 2026.
3. Newman-Hung NJ, Khabaz K, Ding R, et al. Limitations of currently <a href="https://myappsplus.com/apple-homes-new-video-doorbell-smart-cameras-now-available-to-order/” title=”Apple Home's new video doorbell, smart cameras now available to order”>available sarcoma prediction tools in a large contemporary upper extremity soft tissue sarcoma cohort. J Surg Oncol. 2025;132(5):959-967. doi:10.1002/jso.70043
