

Evaluation Design and Generalization
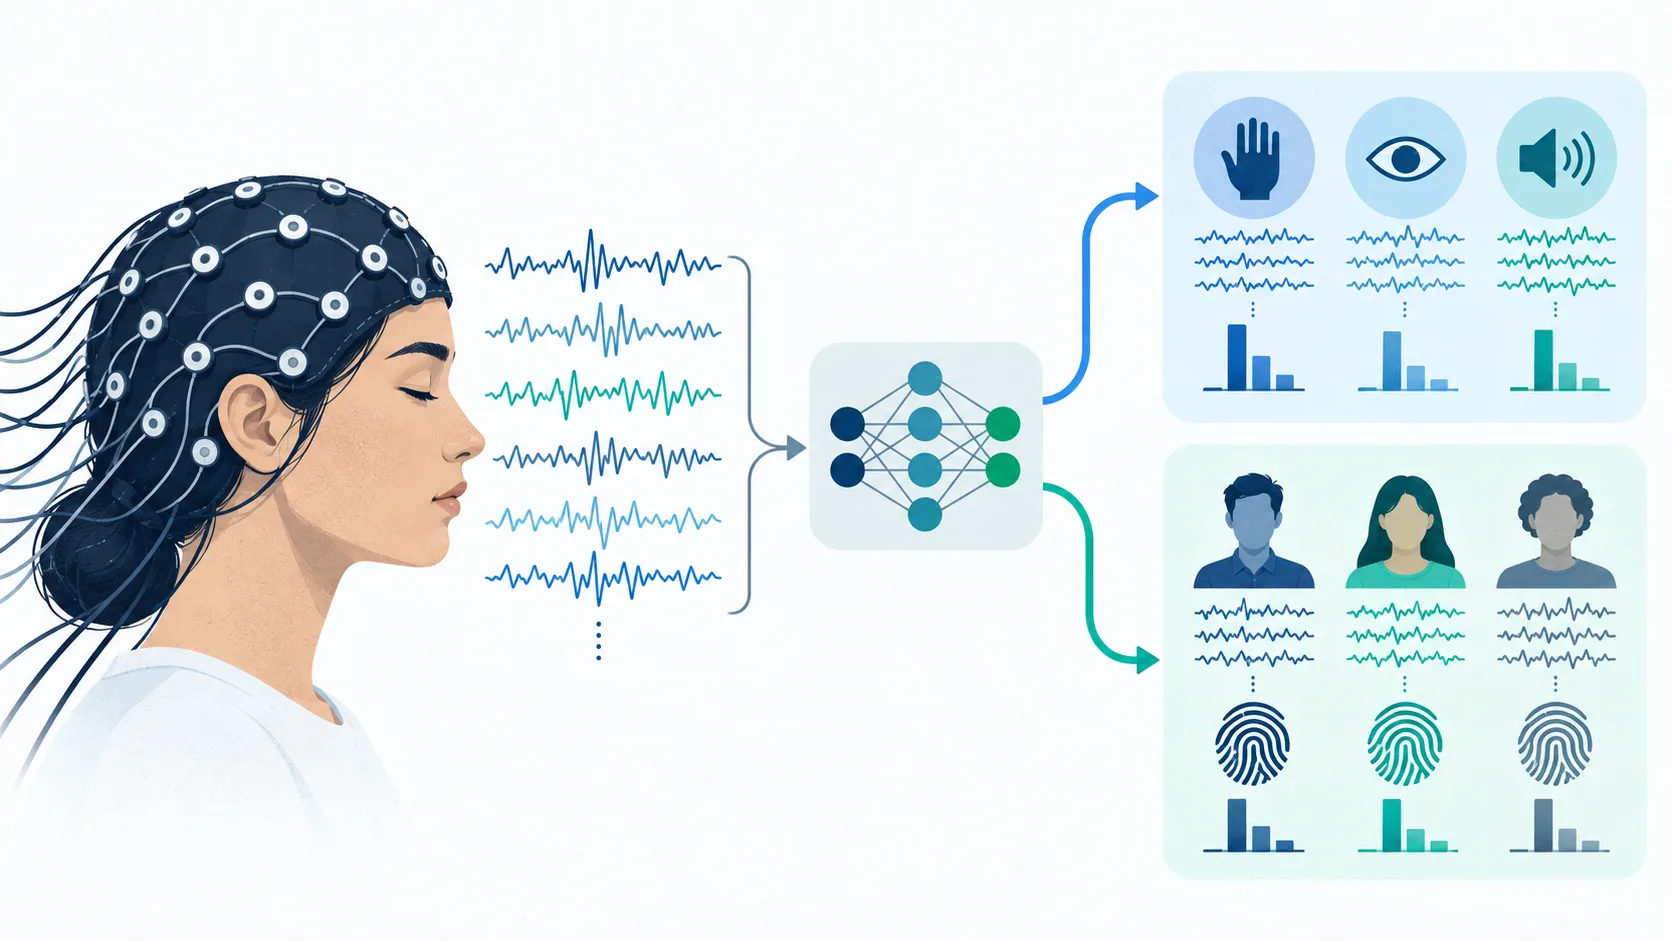
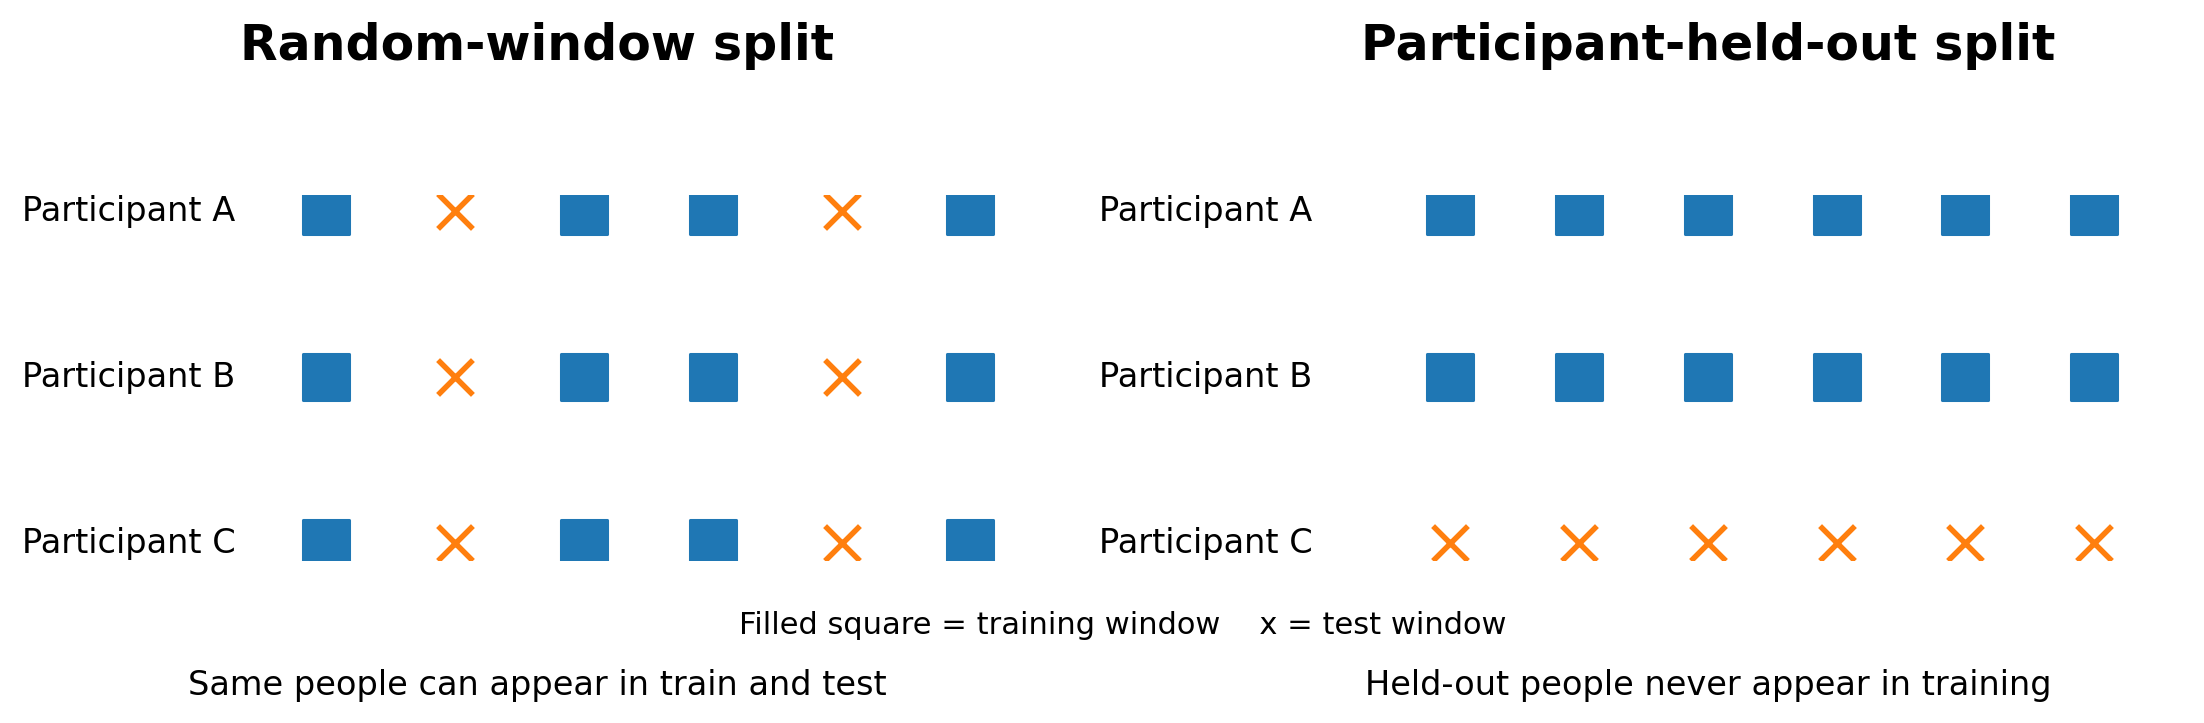
When implementing an EEG machine-learning pipeline, there are many samples obtained from a small number of subjects. One recording can be divided into multiple windows, which then can be randomly split into train and test splits. This produces a sample size that might seem very big. Yet, if the same subject’s windows are present in both splits, the evaluation procedure does not test for the generalization onto new subjects but rather checks how well the model classifies windows from subjects that were possibly seen before.
This difference is important because EEG recordings can contain substantial participant-specific structure. The same issue appears across many machine-learning problems built from repeated measurements, including wearable sensors, medical monitoring, behavioral data, and other subject-level datasets. Whenever samples from the same person or source can appear in both training and testing, model performance may reflect familiarity with that source rather than true generalization to new ones. Recent research in translational EEG shows that segment-level holdout produces much more optimistic results than subject-level holdout when the target variable is the performance on unseen subjects [1]. In this study, we replicate the same evaluative scenario in the simplest possible case: the comparison of background EEG data to the EEG data acquired during the mental arithmetic task using classic spectral features and three standard machine learning algorithms.
The setup of this experiment was deliberately simple. While the feature extraction pipeline stayed the same, we changed the evaluation methodology. Two additional controls were implemented: one to see if the feature extraction alone can distinguish between subjects and another to balance the class of background and arithmetic windows.
Dataset and Feature Extraction
The dataset used for the analysis consisted of the EEG During Mental Arithmetic Tasks (EEGMAT) from PhysioNet [2,3]. It contains 36 EEG recordings of both background and mental arithmetic. For each subject, there is one background recording and one mental-arithmetic recording.
The original description states that sampling frequency is 500 Hz, background segments are 180 seconds long, mental-arithmetic segments are 60 seconds long, and electrode placement according to the International 10/20 system [3].
In the present analysis 19 EEG scalp channels were used, whereas ear-reference difference channel and the ECG channel were ignored. The signal for each channel was filtered by the band-pass filter in the range 1-40 Hz and split into non-overlapping 4-second windows. The result of this process is 2,134 windows in total: 1,594 background windows and 540 arithmetic windows, with unequal quantities being caused by the differences in recording lengths.
Power spectral density was calculated for each channel and window by means of Welch’s method [4]. Relative power was computed by summing up four frequency bands—theta (4-8 Hz), alpha (8-13 Hz), beta (13-30 Hz) and low gamma (30-40 Hz) bands, normalized by the sum of all powers in 1-40 Hz range. Multiplying 19 channels by 4 bands results in 76 features per window.
The task was not to develop a new physiological biomarker in the context of this study. That is why conventional and easy-to-understand features were chosen in order to isolate the effect of evaluation technique.
Evaluation Protocols
Three classifiers were compared: class-weighted logistic regression, an RBF-kernel support vector machine, and a class-weighted random forest with 300 trees. Scaling for logistic regression and the SVM was performed inside scikit-learn pipelines so that the scaler was fit on training data only. Random-window evaluation used ten stratified 80/20 shuffle splits. Windows were the unit of randomization, allowing a participant to contribute windows to both training and testing. Participant-held-out evaluation used six-fold GroupKFold with participant ID as the grouping variable. In every grouped fold, the test participants had zero windows represented in training. Balanced accuracy served as the primary metric because the original window-level dataset was imbalanced; ROC-AUC was also evaluated. Importantly, the two protocols estimate different quantities: the first measures performance on held-out windows when participant overlap is permitted, whereas the second measures transfer to entirely unseen participants.
Performance Across Evaluation Strategies
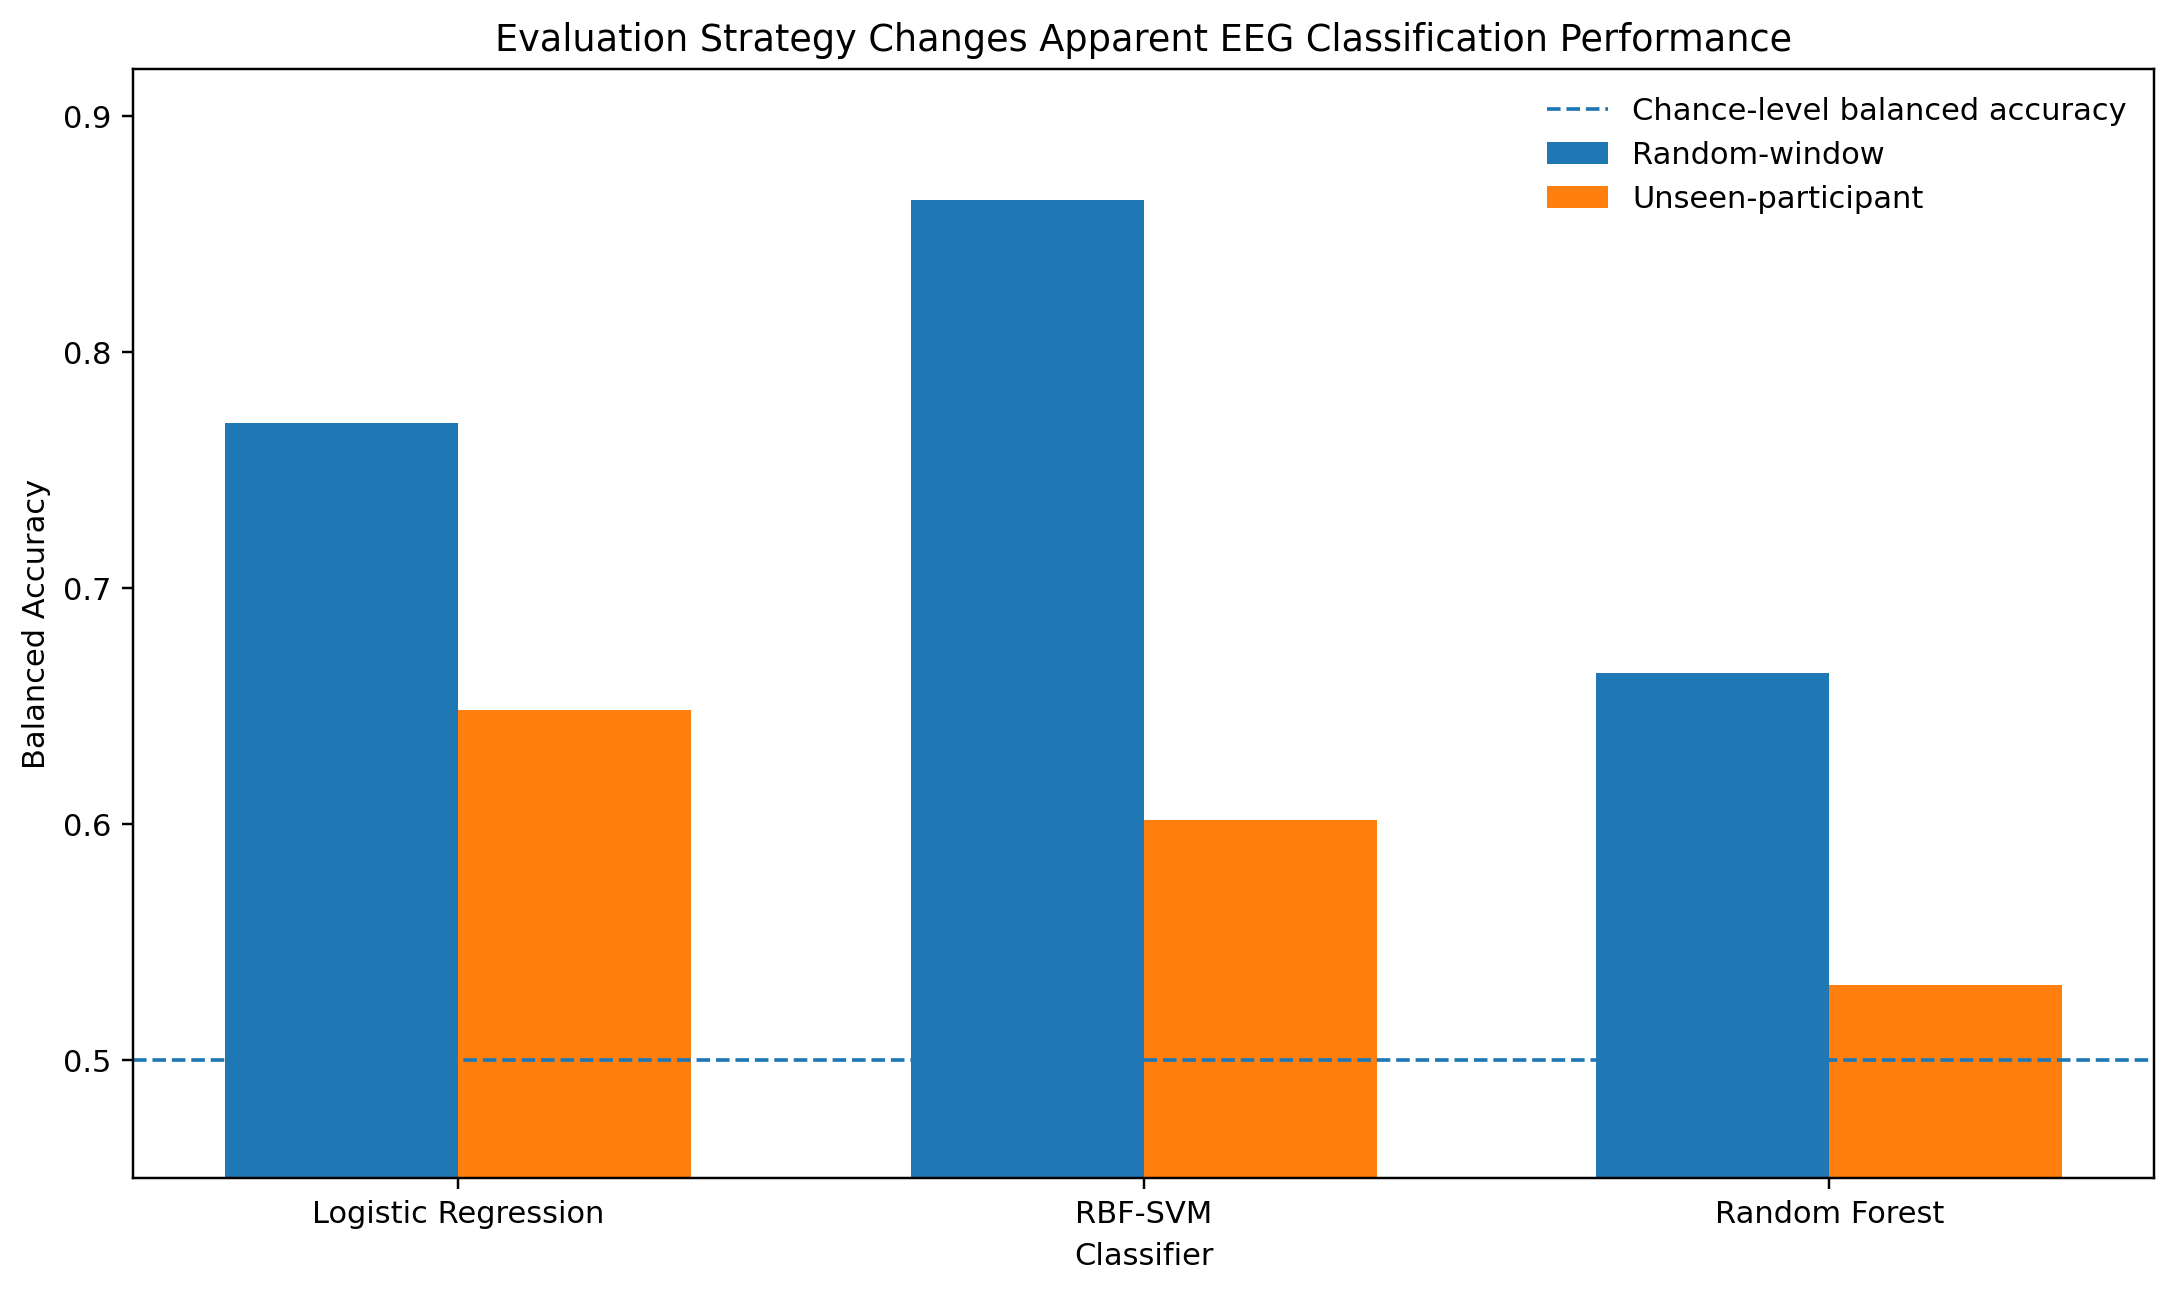
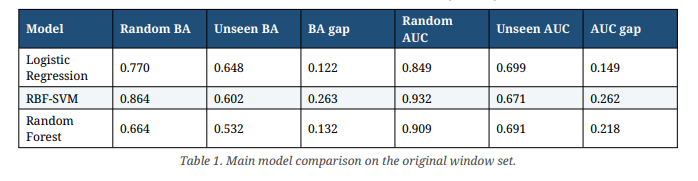
All three classifiers performed worse when entire participants were held out. Logistic regression fell from 0.770 to 0.648 balanced accuracy. The random forest fell from 0.664 to 0.532. The largest difference appeared with the RBF-SVM: 0.864 under random-window evaluation versus 0.602 on unseen participants, a 0.263 absolute gap. ROC-AUC showed the same broad pattern. Logistic regression dropped from 0.849 to 0.699, the RBF-SVM from 0.932 to 0.671, and the random forest from 0.909 to 0.691. The fact that the pattern appeared across a linear model, a nonlinear kernel model, and a tree ensemble makes it harder to dismiss as an idiosyncrasy of one classifier.
Participant Identity as a Diagnostic Control
However, performance discrepancy per se does not provide any insight into how the mechanism works. In particular, there is a potential problem of having participant-specific structure on both sides of the split, due to random-windows analysis. In order to see whether such a problem exists in the case of 76 spectral features, the classification goal has been completely changed from predicting the background/arithmetic discrimination to predicting which out of the 36 participants created each window. The first identity classifier was successful in 95.6% of cases compared to the 2.8% chance level. Since the original database had about three times more background windows than arithmetic windows, a stricter control procedure was used. For each participant, 15 background and 15 arithmetic windows were taken randomly, creating a total of 1,080 windows with equal numbers of windows of different conditions for each participant.
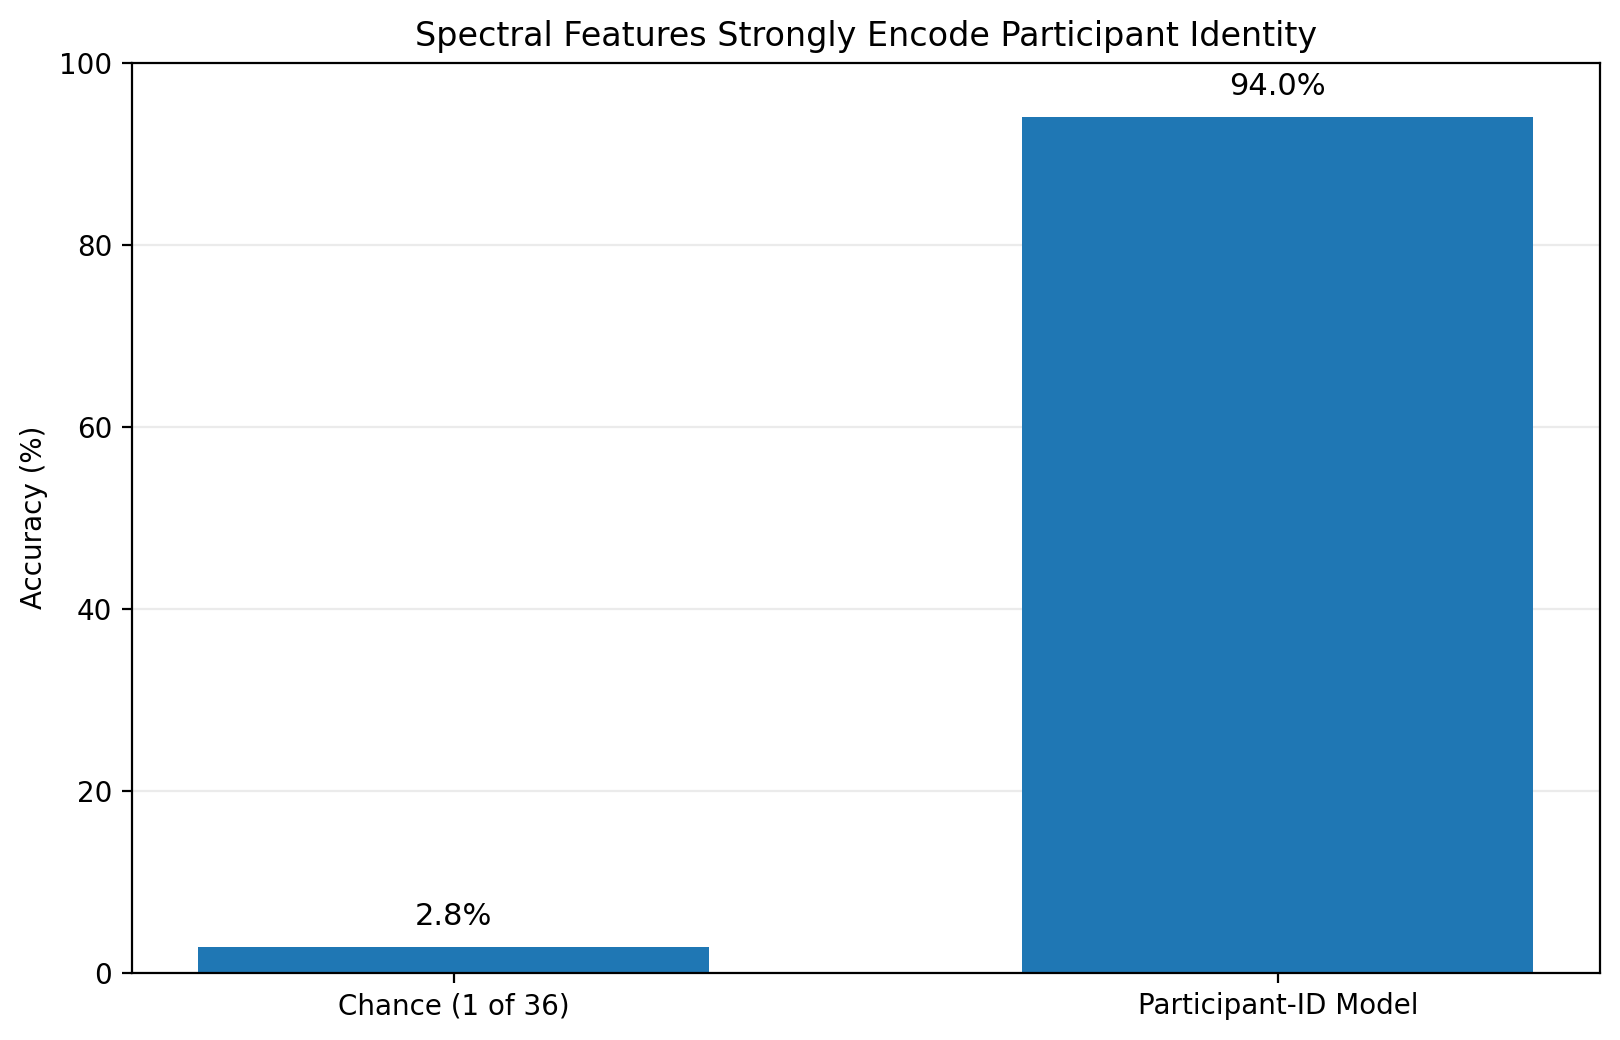
The performance of identifying participants reached 94.0% accuracy, which is 33.8 times better than chance, with top-3 accuracy being 99.5%. The above figure cannot be taken as evidence that the classifiers use participant identity as their decision rule. Instead, it shows that the representation contains substantial participant-specific information, which can make random-window evaluation overly optimistic when participants overlap between training and testing
Condition-Balanced Control Analysis
The original task classification dataset consists of 1,594 background windows and 540 arithmetic windows. While metrics like balanced accuracy and class weight balance the effect of imbalance directly, another control test was performed to find out if the primary result holds true even when there is no imbalance at all.
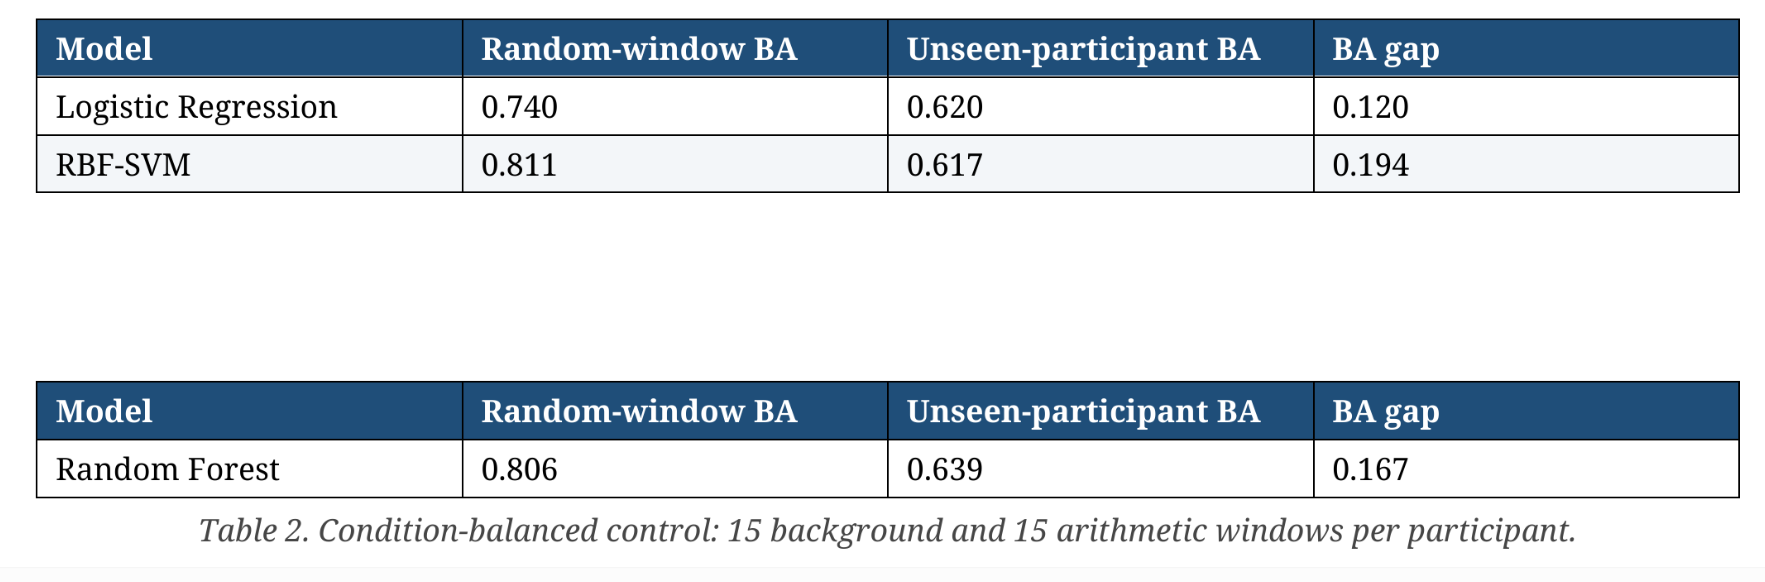
The three-model test was repeated using the balanced subset of 1,080 windows, consisting of 540 background and 540 arithmetic windows, where each participant had 30 windows. The difference in performance between the random-window approach and the unseen participant approach was still seen in all three classifiers: 0.120 for logistic regression, 0.194 for RBF-SVM, and 0.167 for the random forest. Thus, class imbalance cannot be the lone cause of the evaluation difference.
Participant-Level Generalization Variability
One average of cross-validation may hide substantial differences in the ability of the model to generalize. For this reason, the out-of-fold predictions obtained by grouped logistic regression analysis were kept, and the balanced accuracy was calculated separately for each participant. The average balanced accuracy per participant was 0.649 with the median of 0.644 and standard deviation between participants of 0.143. Resampling 10,000 times the group of participants yielded a 95% confidence interval for the mean value equal to 0.602 – 0.695. The individual values of balanced accuracy varied from 0.289 to 0.956, with 5 out of 36 participants having the value less than the 0.50 chance level.
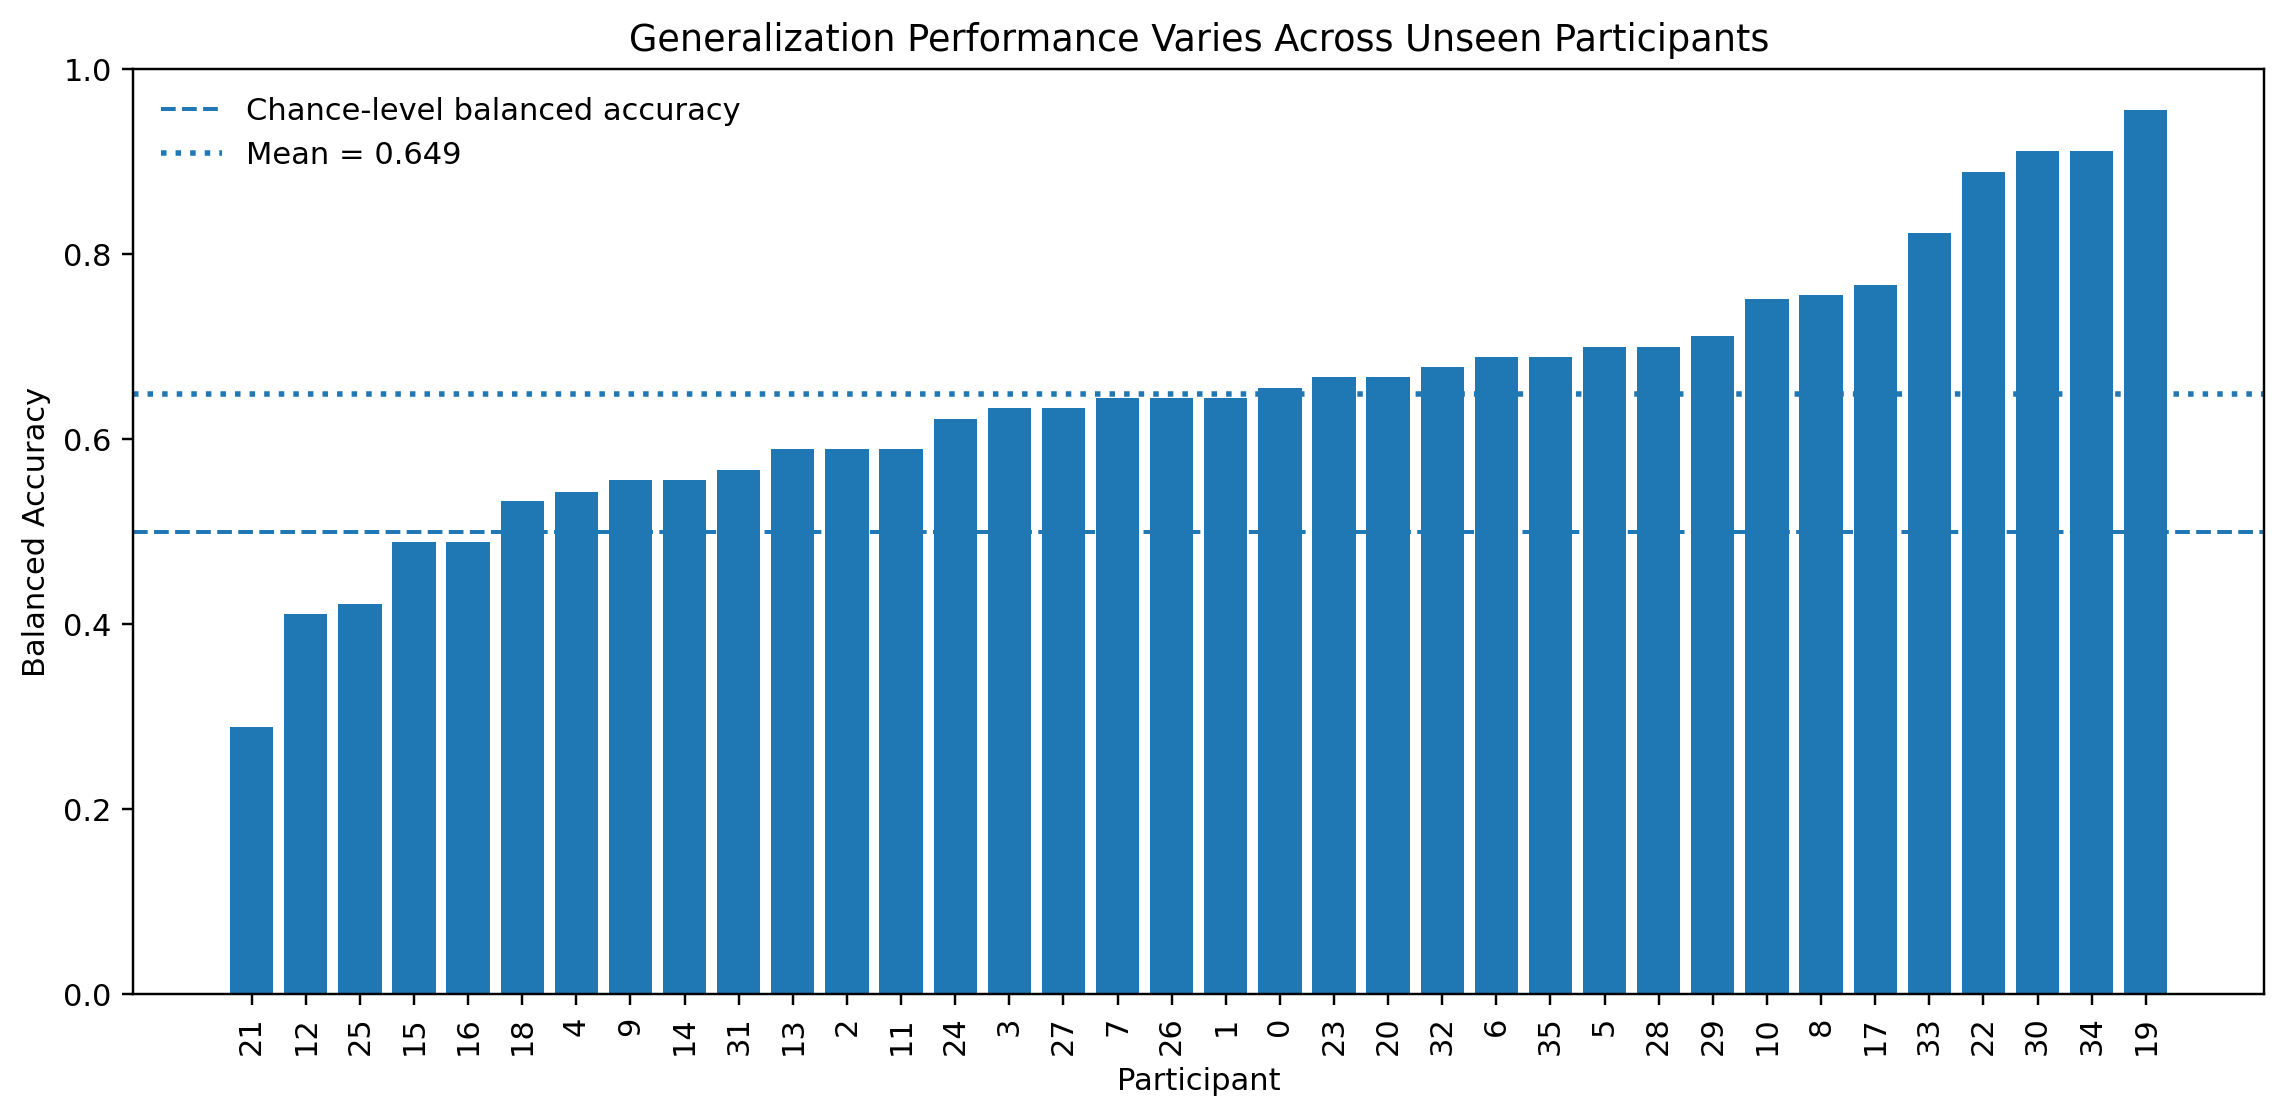
The above difference is not only a theoretical point, but also a practical one, as a model that performs well on an average basis can behave differently in different participants.
Interpretation of the Findings
The strongest conclusion is methodological: evaluation design materially changed the apparent performance of these EEG classifiers. Across three model families, random-window evaluation produced higher balanced accuracy than evaluation on unseen participants. The same spectral representation also contained enough participant-specific information to identify people with 94.0% accuracy after condition balancing, and the task-classification gap survived a balanced-condition control.
Several conclusions are not supported by these experiments. Participant-ID predictability does not establish that identity caused every component of the task-classification gap. The analysis also does not determine whether the identity signal arose from stable physiology, electrode placement, recording-session characteristics, residual artifacts, or a combination of factors. Nor does it imply that every window-level EEG benchmark is invalid. A window-level split can be appropriate when the intended question explicitly concerns new segments from already observed participants.
The important rule is simpler: the split should match the generalization claim. If the claim is performance on a new person, that person cannot be represented in training. Any learned preprocessing, feature selection, dimensionality reduction, or hyperparameter tuning should respect the same boundary.
Limitations
This is a focused benchmark, not a universal statement about EEG machine learning. It uses one public dataset with 36 participants and one hand-engineered spectral representation. Deep networks, connectivity features, raw-waveform models, other tasks, and larger datasets may show different gaps. The labels here are background versus mental-arithmetic task state; they should not be treated as a universal binary ground truth for cognitive load.
The two headline evaluation protocols also use different resampling structures: ten stratified random-window splits versus six participant-grouped folds. Their difference is therefore descriptive rather than a formal causal estimate of leakage. The participant-level bootstrap is used separately to quantify uncertainty in unseen-participant logistic-regression performance. Finally, this analysis did not attempt to localize the participant-specific information to particular channels or bands; that would be a useful follow-up experiment rather than something to infer after the fact.
Implications for EEG Machine Learning
The most important number in an EEG classifier may not be its accuracy. It may be the definition of the test set. In this experiment, the same underlying task, features, and model families looked substantially stronger when test windows could come from participants represented in training. Once the question became, “Can this model classify EEG from a person it has never seen?”, performance dropped — by as much as 0.263 balanced-accuracy points for the RBF-SVM. At the same time, the spectral features were highly informative about participant identity. That combination is a useful warning for any machine-learning problem built from repeated measurements: windows are not people. When the deployment target is an unseen person, the evaluation should be built around unseen people too.
Reproducibility and Implementation
The analysis was implemented in Python using MNE, NumPy, pandas, SciPy, matplotlib, and scikit-learn. EDF files were read with MNE; power spectral density was estimated with scipy.signal.welch; scaling and classifiers were implemented as scikit-learn pipelines where applicable. Random seeds were fixed for the reported resampling and balancing steps. The complete analysis script used to generate the results accompanies this manuscript package.
Image and Figure provenance: All figures and graphics in this article were created by the author from the results of this analysis.
Featured image: Created by the author of this article.
References
[1] G. Brookshire et al., “Data leakage in deep learning studies of translational EEG,” Frontiers in Neuroscience, 18, 1373515 (2024). https://doi.org/10.3389/fnins.2024.1373515
[2] PhysioNet, “EEG During Mental Arithmetic Tasks,” version 1.0.0. https://doi.org/10.13026/C2JQ1P
[3] I. Zyma, S. Tukaev, I. Seleznov, K. Kiyono, A. Popov, M. Chernykh, and O. Shpenkov, “Electroencephalograms during Mental Arithmetic Task Performance,” Data 4(1), 14 (2019). https://doi.org/10.3390/data4010014
[4] P. D. Welch, “The Use of Fast Fourier Transform for the Estimation of Power Spectra: A Method Based on Time Averaging Over Short, Modified Periodograms,” IEEE Transactions on Audio and Electroacoustics 15(2), 70-73 (1967). https://doi.org/10.1109/TAU.1967.1161901
Dataset license: The EEG During Mental Arithmetic Tasks (EEGMAT) dataset is distributed by PhysioNet under the Open Data Commons Attribution License v1.0 (ODC-By 1.0).
