

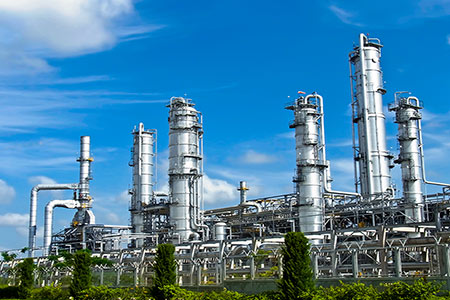
This article presents a structured analytical methodology for diagnosing performance variability and reliability-related behaviour in GE’s LM6000 gas turbines using time-series operational data. The approach integrates statistical screening, information-theoretic analysis, and machine learning techniques to identify key variables influencing turbine performance under varying operating conditions.
Two LM6000 aeroderivative gas turbines operating at different plant locations are analysed to evaluate differences in operating characteristics, dynamic response, and variable interactions. A defined set of process and control variables – including turbine power, fuel flow, compressor discharge pressure, variable geometry positions, inlet conditions, and environmental parameters – are used to construct a multi-dimensional dataset representative of turbine operation.
The methodology focuses on isolating variable interactions, identifying pre-event behaviour, and distinguishing operating regimes to improve the interpretability of complex system dynamics. Techniques such as correlation analysis and transfer entropy are applied to capture both linear associations and directional, non-linear dependencies between variables. Additional steps are taken to address common challenges in high-dimensional datasets, including feature redundancy and data leakage.
The objective of this work is to demonstrate how a physics-informed, data-driven framework can be applied to turbomachinery to enhance the identification of performance drivers and support more efficient diagnostic workflows. The analysis further evaluates the consistency of data-driven findings with independent OEM assessments, providing an additional layer of validation for the methodology.
Understanding gas turbines
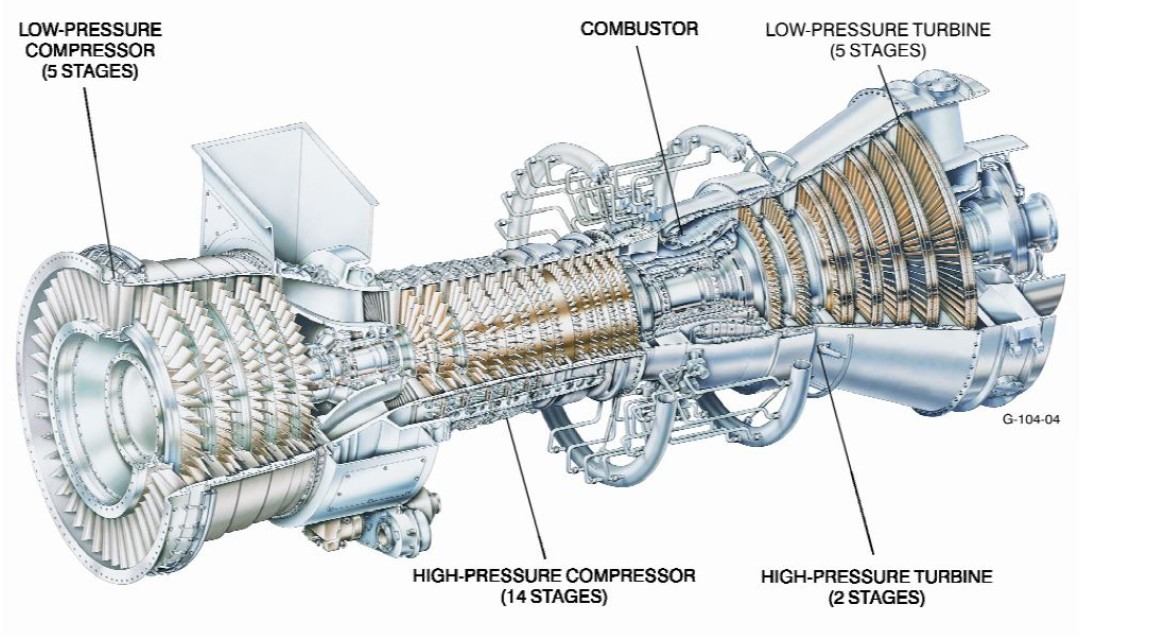
Figure 1 provides a general overview of the LM6000 gas turbine architecture, establishing the physical context for the data-driven and machine learning analyses presented in the following sections. A brief history of GE’s LM6000 gas turbine engines show that these are complex, engineered, high-efficiency machines. They are aeroderivate, direct drive, gas powered engines and, in particular, the LM6000 is an extraction of the CF6-80C2, high-bypass, turbofan aircraft engine. These engines are mechanically coupled rather than aerodynamically coupled on a common shaft. This means that the engine has a free power turbine that is mechanically coupled to the generator. The author would like to clarify this difference, in an aero coupled turbine the driven load can influence the compressor operation through the gas path and not through a mechanical shaft. In the case of LM6000, this influence is not through the gas path but rather through mechanical means and so it is mechanically coupled. If the load changes on this system it will not shift the operating point immediately or the surge margin on the compressor, as it is not directly load dependent, among other attributes. This is an important distinction since this article will consider power changes and its effects through machine learning models. This provides for a good and valid assumption for the LM6000 engine in the sense that compressor behaviour and surge margin can be analysed independently of the generator load due to the free power turbine configuration, load effects might enter only indirectly through exhaust backpressure. The article is not meant to substitute a design understanding and operation of a LM6000 but rather to address how machine learning, data analysis, and the utilisation of agents can assist with reducing the time to assess data and quickly converge on what variables are drifting and leading potential issues in a complex engine such as the LM6000.
Machine learning methodology
A Python-based reliability and analytics pipeline was developed to process and analyse time-series data from the turbines. This section outlines the underlying methodology used for data analysis and machine learning; readers are encouraged to consult additional resources for a deeper understanding of specific algorithms and implementation techniques. The pipeline is structured around a defined target variable – turbine power in this case – along with rotor speed (RPM) to identify and characterise trip events. Initial analysis includes association screening to evaluate linear relationships using correlation, followed by the application of transfer entropy to capture directional and non-linear dependencies after data discretisation. This combined approach allows for a more comprehensive understanding of interactions between variables beyond simple correlation.
Event detection is subsequently performed to identify turbine trips and power fluctuations. For periods without trips, the analysis focuses on deviations in power behaviour. To determine the drivers of these events, variables are analysed over defined pre-event windows, capturing system behaviour immediately prior to a trip or fluctuation. This approach involves evaluating statistical features within discrete time intervals, including mean, standard deviation, and linear trends (slopes), to characterise variable behaviour leading up to an event. Such analysis enables the identification of key features with a higher likelihood of contributing to specific outcomes. Random Forest classification was applied to evaluate feature importance and identify variables most strongly associated with trips and power fluctuations. In addition, Shapley Additive Explanations (SHAP) were utilised, where applicable, to provide further interpretability of model outputs. Power fluctuation events were defined as instances where the target variable deviated by more than ±X% from a rolling median baseline, while trip events were defined as transitions where RPM dropped below a defined threshold (≤0 by default). Event time was recorded at the first instance meeting the down-state condition.
For each identified event, features were extracted from a pre-event window of length W samples. Care was taken to avoid data leakage, which can occur when variables directly encoding the event definition are inadvertently included in the model. For example, since trip events are defined by a drop in RPM, including RPM-derived features would trivially predict the event without providing meaningful insight. To mitigate this, engineered features derived from RPM were excluded from trip prediction models, and features derived from the target variable were excluded from power fluctuation models.
Given the large number of variables in complex systems such as the LM6000, operating regime identification is essential to understand whether anomalies or trips are associated with specific conditions. In this study, operating regimes were identified using k-means clustering applied to a subset of high-variance process variables following standardisation and mean imputation. The resulting regime centroids were subsequently transformed back into engineering units for interpretation.
Data analysis and feature engineering
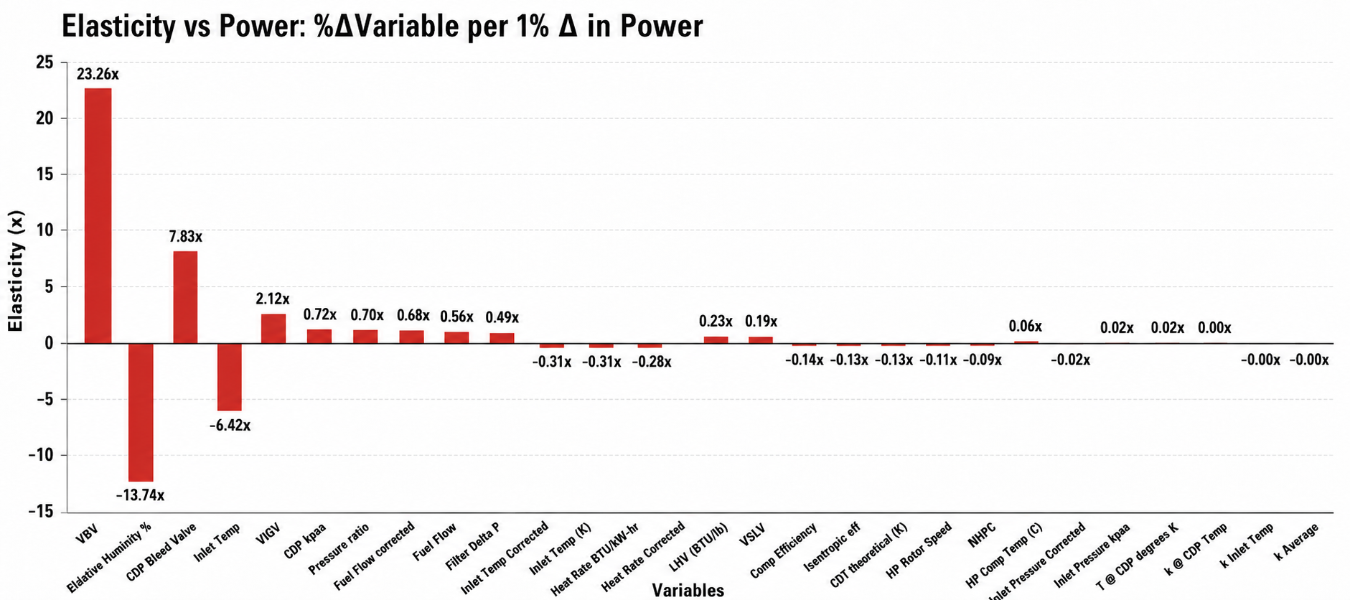
Elasticity studies on key variables can provide additional insight in understanding which variables cause a percentage fluctuation in a specific variable, see Figure 2, this figure essentially shows how the various features like VBV, relative humidity, and inlet temperature affect a 1% change in power. This important insight helps in narrowing down key features and their effect on studied variables which in turn helps in determining the most appropriate features that could be inputted into machine learning algorithms. It also provides insight in differentiating what variables are actively responding vs what variables are being controlled. This does not mean that specific variable causes the power fluctuation but provides insights into how the variable responds given the power fluctuation. Finally, Random Forest classifiers were trained to distinguish pre-event conditions from normal operation. Driver variables were ranked using feature importance metrics and, where available, SHAP mean absolute attribution values. Event-aligned trajectories were also generated to visualise the evolution of key variables leading up to events. It is important to note that correlation does not imply causation. While correlation heat maps provide insight into linear associations, transfer entropy offers a measure of directional information flow between variables, supporting a more robust interpretation of potential causal relationships. Both methods play an important role in feature engineering and system-level assessment.
A correlation heat-map was also developed to compare correlation among the different turbine variables between Turbine 1A and Turbine 1B to provide additional insights into how the variables interact with each other and also to complement the elasticity studies from Figure 2. Since it is important to understand causality in addition to correlation, transfer entropy and other data analysis tools are utilised. A comparison of key metrics between Turbines 1A and 1B is presented in Figure 3. The analysis incorporates transfer entropy, which provides a measure of directional influence between variables and serves as a proxy for causality within the system. Unlike correlation heat maps, which capture only linear associations, transfer entropy evaluates the flow of information between variables and is capable of identifying non-linear and directional relationships.
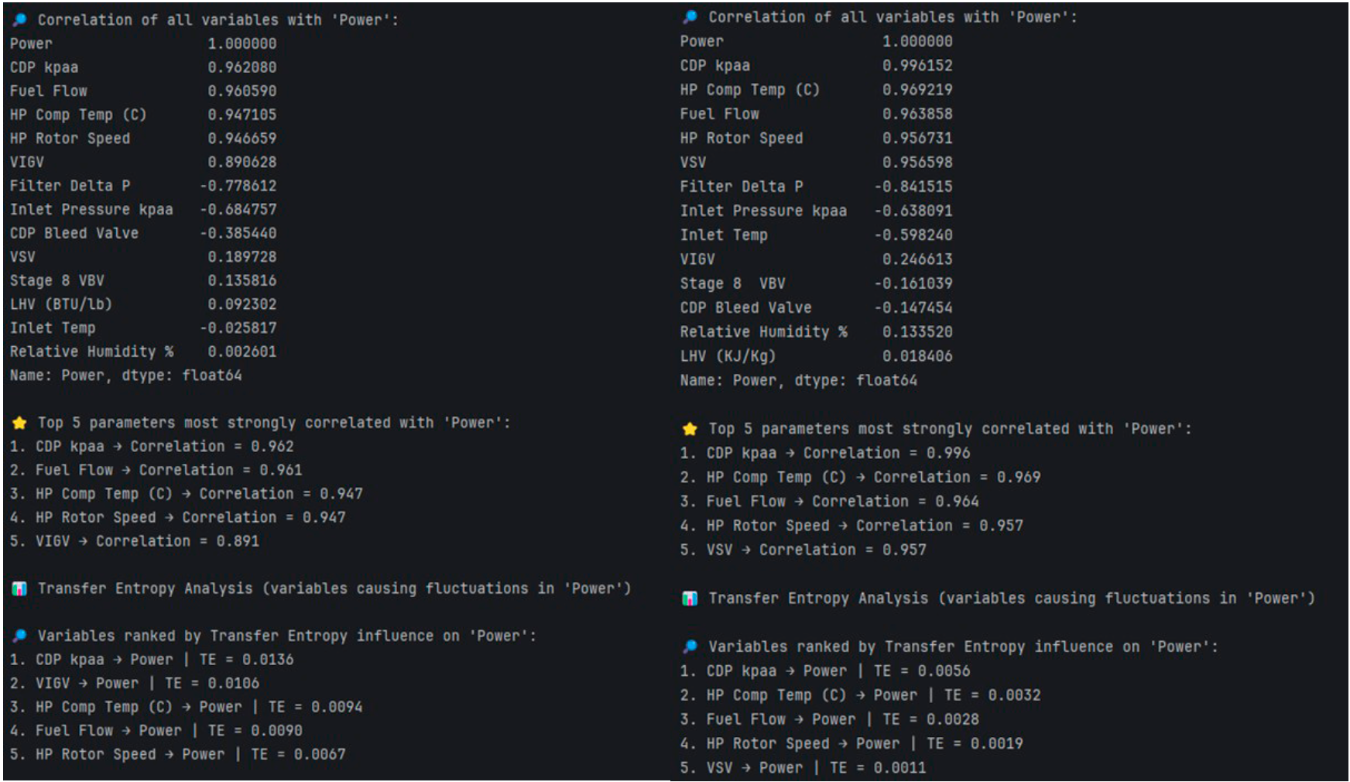
Based on this analysis, Turbine 1A exhibits a stronger influence of Variable Inlet Guide Vane (VIGV) position on power relative to Turbine 1B under the operating conditions studied. This suggests that VIGV behaviour plays a more significant role in driving power variability in Turbine 1A, highlighting a potential area for further investigation in terms of control response, mechanical condition, or operating strategy.
Engineering validation and practical application
A critical aspect of analysing complex turbomachinery data is the segmentation of operating conditions into distinct regimes. By decomposing the dataset into representative operating regimes, it becomes possible to better understand where the system predominantly operates and to differentiate conditions under which trips or anomalies occur. OEM recommendations based on one of the turbines was to consider a water-wash, monitoring compressor key parameters such as polytropic head and efficiency can help determine quickly if compressor performance is degregading and water-washing-like procedures are truly necessary. In this case water-washing was delayed since compressor head/efficiency was not showing an underlying issue with debris build up within the compressor gas path.
Operating-regime segmentation provides a concise framework for identifying operating envelopes associated with abnormal behaviour, thereby supporting more effective and targeted root cause analysis. These regime maps provide a concise visual framework for identifying operating envelopes associated with abnormal behaviour, thereby supporting more effective and targeted root cause analysis. For example, elevated NOX emissions may occur only within specific operating regimes. In such cases, the problem is more effectively framed as a classification task – identifying the conditions under which high NOX occurs – rather than as a regression problem aimed at predicting exact emission values. This approach enables clearer identification of operating scenarios that lead to emissions excursions, which may in turn result in power deration and reduced megawatt output. In practical machine learning applications involving high-dimensional turbomachinery datasets, models such as Random Forest or XGBoost may exhibit reduced performance when evaluated using regression-based metrics such as R2 or mean squared error (MSE). This behaviour is often not attributable to deficiencies in the algorithms themselves, but rather to factors such as large feature sets, feature redundancy, or data leakage. In some cases, variables that directly encode the target behaviour can bias model outputs, while exclusion of key physics-based variables may limit the model’s ability to capture system dynamics. It is therefore necessary to define the analytical objective clearly and align the modelling framework accordingly. When the objective is to identify conditions associated with events such as elevated NOX emissions or power fluctuations, classification-based approaches are often more appropriate. In these cases, performance metrics such as receiver operating characteristic (ROC-AUC) or precision-recall (PR-AUC) provide a more representative evaluation of model effectiveness than traditional regression metrics.
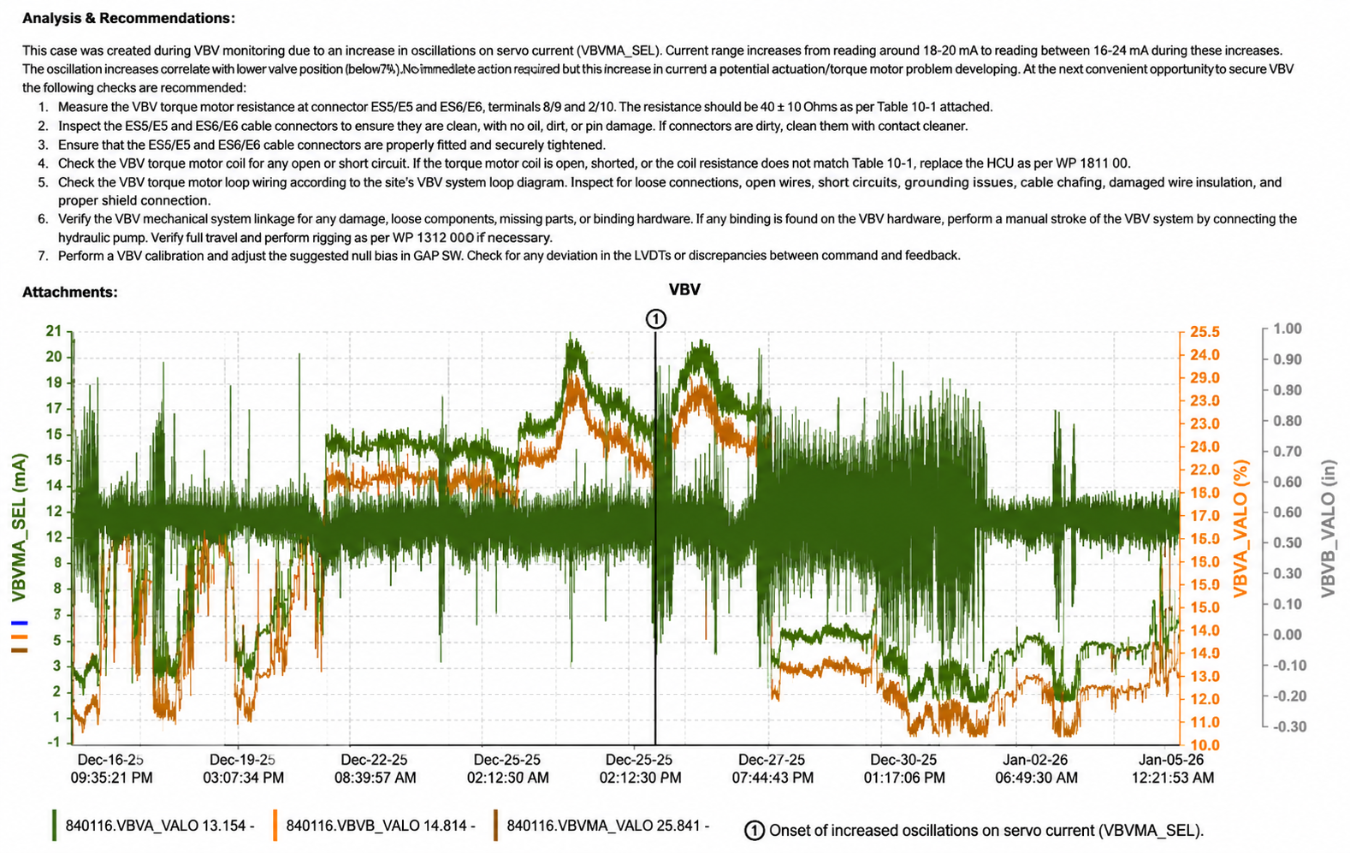
When appropriately structured, machine learning models can be used to quantify the relative importance of variables and their contribution to specific outcomes. The results presented in Figure 4 demonstrate that turbine trip behaviour is influenced by a limited subset of variables, despite the high dimensionality of the dataset. A similar approach can be applied to power fluctuation events to identify dominant contributors. Notably, the variables identified through the analysis are consistent with findings from an independent OEM investigation, which highlighted concerns related to variable bleed valve (VBV) operation. Supporting evidence of VBV behaviour, including oscillatory response observed within the control system, is presented in Figure 5. This consistency between data-driven analysis and OEM diagnostics provides validation of the analytical framework and supports targeted follow-up actions, such as control system evaluation or component-level inspection.
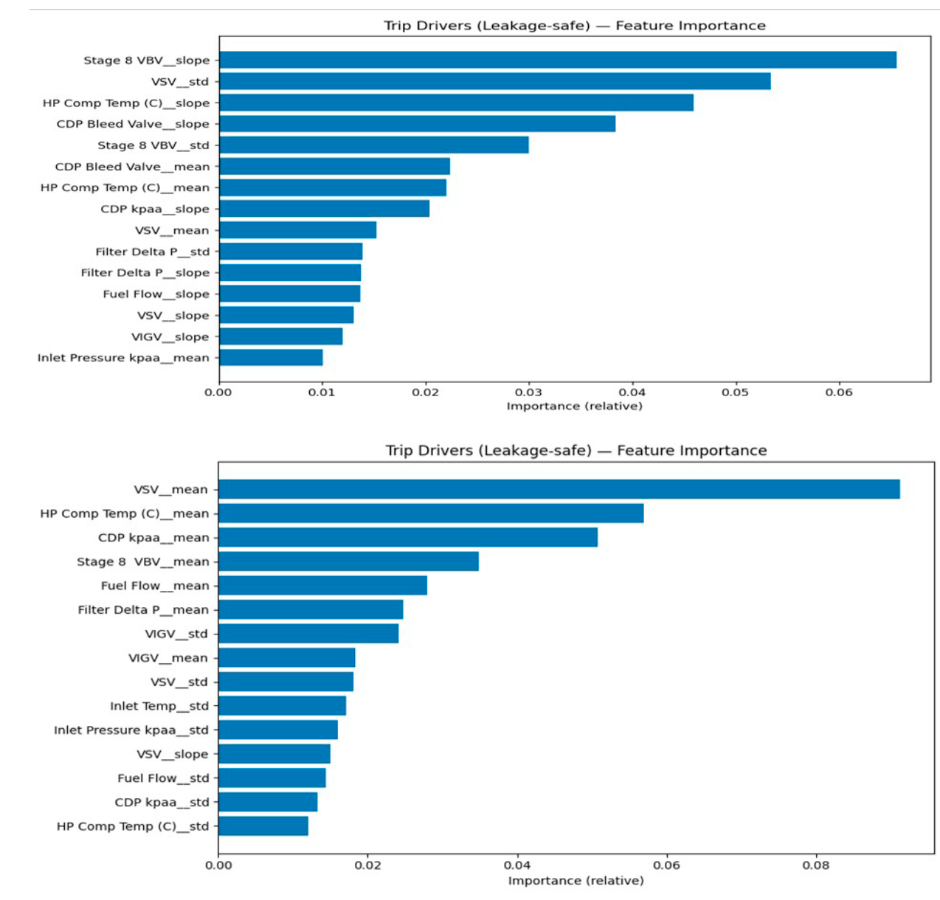
A comparative assessment of contributing features between the two turbines further indicates that variable influence is not uniform across units, even under comparable operating conditions. Differences in the relative importance of parameters such as VIGV position and compressor-related variables highlight unit-specific behaviour, reinforcing the need for turbine-level analysis rather than reliance on generalised assumptions. Additional analyses, including sensitivity or elasticity assessments, can be used to quantify the response of system variables to changes in turbine power. These methods provide insight into how perturbations propagate through the system and support evaluation of stability margins and performance degradation mechanisms. From an operational and economic perspective, unresolved performance issues in complex systems such as the LM6000 can result in significant financial impact if not identified and addressed in a timely manner. For example, elevated NOX emissions may require turbine deration, directly reducing power output. Given that each megawatt of generation represents revenue potential, even small reductions in output can accumulate into substantial losses over extended operating periods.For illustrative purposes, a sustained loss of 1 MW at a power price of US$75/MWh corresponds to approximately US$75/hr, or on the order of US$650 000 annually. It is easy to see that a few MWs worth of losses every month can easily translate into millions of dollars worth of revenue, not to mention the cost of repairs. This simplified estimate does not account for additional factors such as fuel inefficiency, contractual penalties, or market variability, which can further increase the overall impact. In practice, the total cost associated with performance degradation may be significantly higher when all operational and commercial considerations are included.
The methodology presented in this work has also been applied to emissions optimisation of an LM6000 gas turbine. Using a similar physics-informed, data-driven machine learning approach, the analysis identified the Turbine B fuel manifold as the primary contributor to elevated NOX emissions. Based on these findings, the OEM performed additional fuel mapping under the technical direction of the author, resulting in a reduction in NOX emissions from approximately 13 ppm to around 10 ppm while maintaining turbine performance. The revised fuel map was subsequently validated by the OEM, demonstrating how data-driven analytics, when combined with engineering expertise and OEM collaboration, can deliver measurable improvements in both emissions performance and operational efficiency.
Conclusion
These results highlight the importance of early identification of performance deviations and systematic evaluation of contributing variables. The analytical framework presented in this study enables prioritisation of key drivers and supports more focused investigation of turbine behaviour. However, application of these methods requires careful consideration of feature selection, model structure, and validation strategy. Incorrect assumptions or poorly constructed models can lead to misleading interpretations. Accordingly, machine learning techniques should be applied in conjunction with established engineering understanding to ensure that results remain physically meaningful and actionable within the context of turbomachinery operation.
